Over the weekend I rolled out a build that provided call stacks for certain errors, under certain conditions. You only get a call stack if:

- The error occurs in Internet Explorer,
- The error happens after page load
I must admit, because of these conditions I was unsure how useful the feature will be. But after having it run for some time now, it looks awesome!
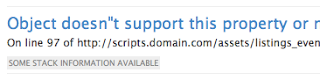
If we were able to capture the call stack of an error, it is highlighted in the errors listing.

The call stack is shown in the error details page for the error.

How it works
One interesting behaviour of IE is that when
window.onerror is called, it doesn't actually destroy the call stack — in fact, the window.onerror function call is placed on the top of the currently executing stack. This is different from how all other browsers behave. We exploit this behaviour in IE.
However, IE doesn't give you a nicely formatted stack trace. In fact, there's no explicit way to get the call stack at all. However, IE does give you a meaningful
arguments.callee.caller, which is used here. We then recursively walk the call stack using arguments.callee.caller.caller etc. to build individual stack frames of the error. We do this for 10 stack frames and stop there, just in case the call stack is for a recursive function.arguments.callee?
arguments.callee refers to the currently executing function. It's a way for a function to know itself, if you will. In JavaScript, since every function is also an object, the function has it's own properties as well. One such property of a function is its .caller, which is a reference to the function that called it. In other words, it's a reference to the function one stack frame below itself.
In the case of
window.onerror, arguments.callee will refer to the window.onerror handler itself, since it points to itself. Once we have a handle to our own function, we can then access properties of our function, as described above.
There's one caveat though. Only IE retains a meaningful
arguments.callee.caller. In all other browsers, this value is null. That's because all other browsers destroy the call stack before calling window.onerror. IE retains the call stack. So, since we have a call stack in IE, we can now recursively call .caller for each function in the stack to know the previous function in the stack.Why after page load?
As I've mentioned several times before, Errorception will always maintain a zero performance cost. I wouldn't use a error reporting system that would cause page load delays for every single user. To ensure that the performance cost is zero, Errorception introduces it's script after page load. This doesn't mean that we don't catch errors from before page load, of course. We do. But we only process them once our script has loaded.
Because of this loading pattern, we won't have access to call stacks from before page load.
arguments.callee.caller will always point to null since the stack has already unrolled. This is why we cannot generate call stacks before page load, even though we have all other error details.But that sucks!
Not really, if you think about it. While it would be awesome if we could get call stacks from before page load as well, these errors are really easy to replicate. That's because the error happens in such a small and predictable time interval that it's easy to recreate it locally. The error happens between when the page started loading and when page load was fired - usually within a couple of seconds, maybe before any user interaction has even occurred.
Caveats
In a lot of cases, the call stack consists of anonymous functions, which isn't very descriptive. I would ask you to rewrite your code using named anonymous functions, but we all know that no one's going to do that. I'm still on the lookout for a decent way to solve this. If you have any suggestions, I'm all ears.
Hi Rakesh,
ReplyDeleteThe call stacks in IE sounds like a wonderful idea! Is this functionality still in Errorception? I looked through my IE error logs and couldn't find any stack information.
Thanks,
Eric
Hi Eric,
DeleteSorry for the delay in responding. For some reason, your post got stuck in a moderation queue, and I wasn't notified about this by blogger.
This feature is available and working fine. It only works for errors that occur after page load. That's because stack information of errors that occur before page load are lost because of our model of loading code lazily. Like I mentioned in the post, I still think this is a good idea, since it minimizes performance impact, and errors that occur before page load are easy to detect anyway.
How about logging the actual function text when the function is nameless / anonymous. As in: callee.toString().replace(/\s*/g, '').substr(0, 256)
ReplyDeleteThen you search your source code database for portions of that text to identify the original copy.
Can't be sure if it'll be useful unless we try it! I'll experiment with this soon.
DeleteI was just introduced to this tool and have looked at a few of the errors that my company has in IE with call stacks. Without some version of this info for anonymous functions these callstacks are entirely useless. Unfortunately the same context that the IE dev tools has for showing the callstack is not available directly through arguments.callee but something like the following was able to show me each step of the callstack from my random breakpoint:
Delete(function(funcObj){var maxFuncStringLength = 256; var anonFuncTest = funcObj.toString().substr(0, maxFuncStringLength); anonFuncTest = (anonFuncTest.length >= maxFuncStringLength) ? anonFuncTest.substr(0, maxFuncStringLength - 3) + "..." : anonFuncTest; return "{anonymous}(" + anonFuncTest + ")"; })(arguments.callee.caller.caller.caller.caller.caller.caller.caller.caller.caller.caller.caller.caller.caller.caller.caller.caller.caller.caller.caller.caller.caller);
Note several things:
- If you try this on some example IE breakpoints of your own you should find the initial 50-256 chars are often enough to identify the code in question (certainly more than a stack trace full of "{anonymous}()" and nothing more.
- The breakpoint I chose is 22 levels from the root of the stack, making it possible to wish for a configurable number of stack frame levels that is greater than 10.
- There is room for optimizing the maxFuncStringLength to a value that sends enough data to uniquely identify an anonymous function and display it intelligently on the error page (e.g. between 40 and 500)
The function.toString() is an interesting idea. I'll see whether it makes sense to incorporate it. Thanks.
Delete